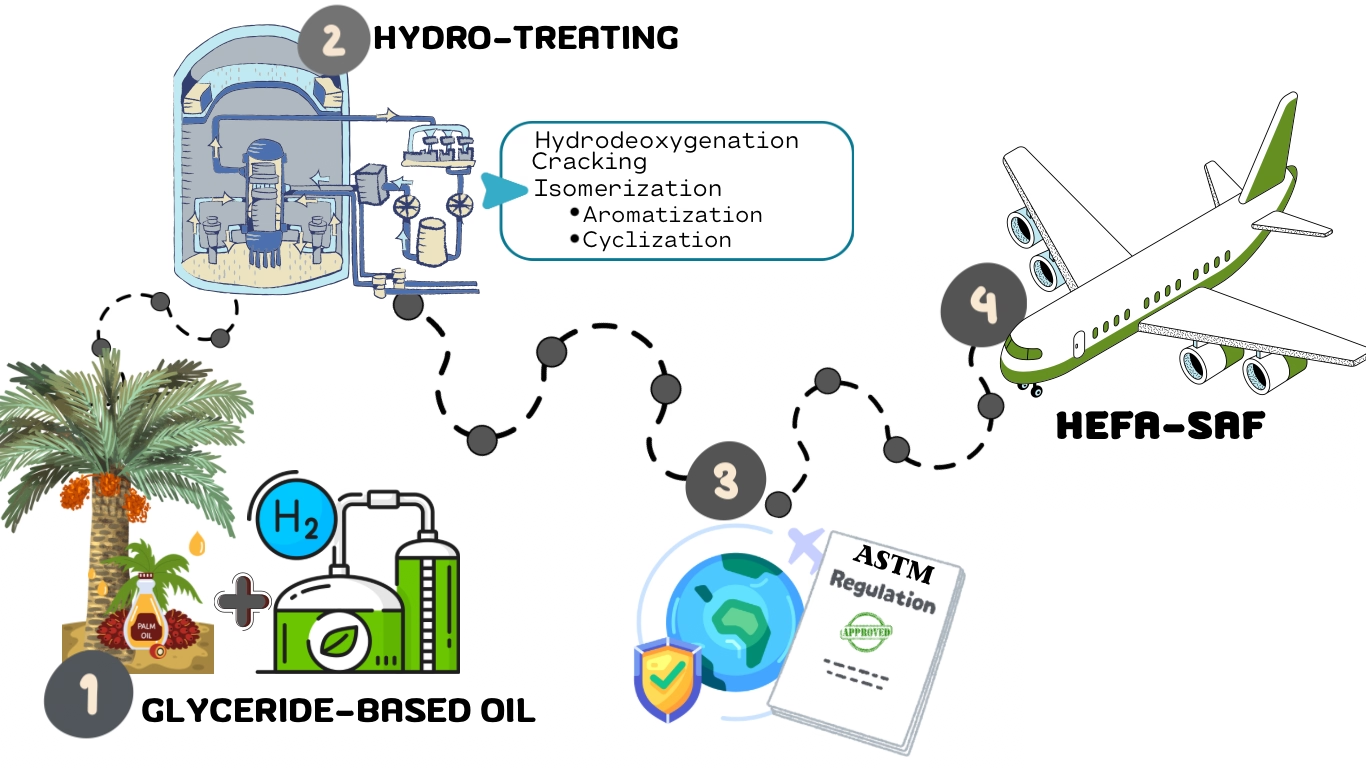
• Graphical representation of e-SAF production process via CO2 capture and hydrogen generation through electrolysis

    Simplified schematic illustration of the experimental setup for the integrated process of CO2 capture and green hydrogen generation for e-SAF production

    Experimental setup to produce SAF range hydrocarbons

    GC-MS/FID result of SAF range hydrocarbons

    Graphical representation of HEFA-SAF production pathway using glyceride-based oils as a feedstock

  • Schematic diagram of the experimental setup for SAF production through HEFA process

    Experimental setup for SAF production through HEFA process

    GC-MS/FID graph of SAF product through HEFA Process